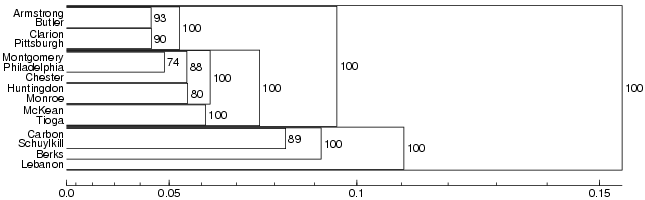
Fuzzy clustering means that the original distance matrix is contaminated with (varying) small amounts of random noise. This is done several times and each time clustering is performed on the contaminated matrix. After that we count how many times each cluster has appeared. Clusters that appear in many runs of the analysis with added noise are particularly stable ones. The results are displayed in a probabilistic dendrogram:
The percentages in the probabilistic dendrogram indicate how many times each cluster was encountered in the repeated clustering with noise. In the example above, the largest clusters have been encountered in all the iterations and have a probability of 100%. We can therefore be pretty sure that these are real clusters. On the lower levels the percentages are somewhat smaller, so we cannot be completely sure about these clusters.
In the settings box you can change the amount of noise used. If the data has a very clear cluster structure it will be detected even with a high amount of noise. By changing the percentage limit, you choose how high the probability has to be for a cluster to be displayed in the dendrogram.
[Exponent?]
In the default settings, a combination of Group Average and Weighted Average is used for clustering. You can also choose to use only one of these two methods.
The colors in the probabilistic dendrogram won't change when you change the settings. They are from a different analysis and are there to help you identify the places in the map under the dendrogram. This map is also displayed at Fuzzy clustering - fuzzy cluster maps.
The map visualizes something between multidimensional scaling (MDS) and cluster analysis: main dialect groups are identified in the map, but continuous relationships are displayed for places which cannot be put in one group with high probability. The map is created by running MDS on the branch lengths of the dendrogram (so-called cophenetic distances) instead of on the original linguistic distances.
[define clustering settings]
This kind of maps will always have four main colors. Displaying four main clusters might not be the optimal solution for all data sets, so before you choose to use this method for displaying your clustering results, you should compare it to the probabilistic dendrogram or use cluster validation.
Below the full fuzzy cluster map, similar maps are available for subsets of the data.