GABMAP is a web application for dialectometrics and cartography. It allows you to make mappings and statistical analyses of your own dialect data. For example, you collected the local variants of the pronunciation of a large number of words in several locations in some area. Using Gabmap you can compare these words, and make dialect maps of the results.
This manual gives explanations to all the functions in Gabmap, including references to relevant literature. A step-by-step tutorial introducing the basic functions is available here.
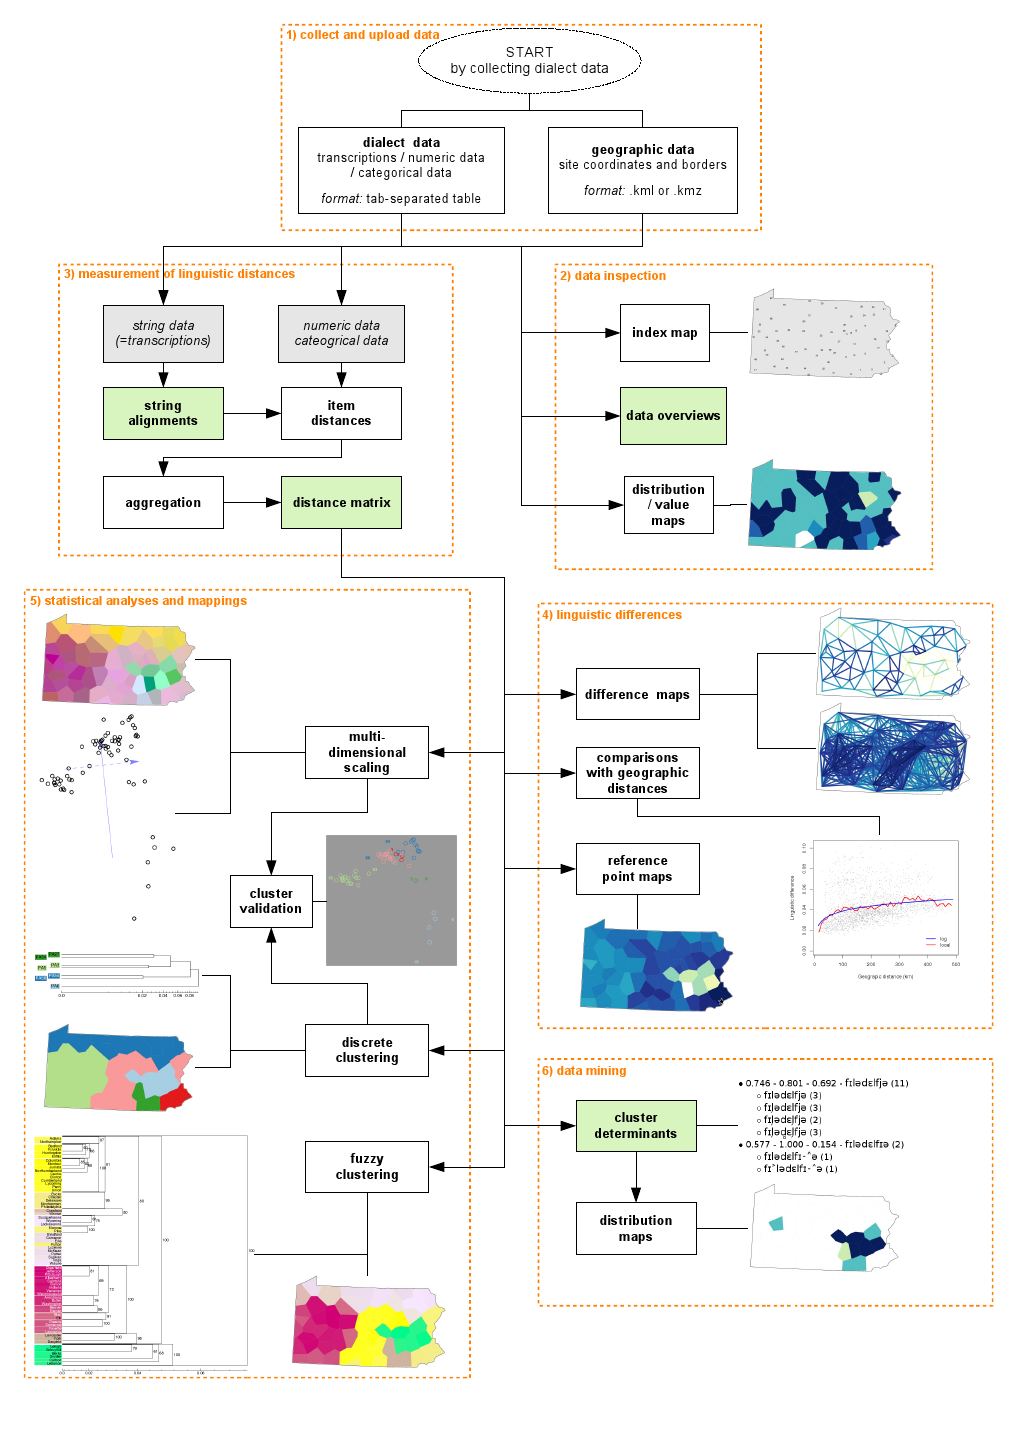
Gabmap offers the following tools:
When you have uploaded your data in Gabmap you will get an overview of the number of places, number of items/words, number of different symbols used in the transcriptions etc. An index map of the data locations is created and there is a possibility to create distribution maps of any specific character(s), combination of characters or variant(s) of a word.
Several of the analyses offered in Gabmap are based on aggregate linguistic distances between language varieties. Different distance measures (i.e., processing types) are available for different types of data. String edit distance is used for measuring linguistic distances based on phonetic transcriptions.
With the statistical tools in the web application you can explore the structure of your dialect data. With multidimensional scaling you can explore to what extent the dialects form a continuum, while cluster analysis classifies the dialects and detects dialect areas. The results of the statistical analyses are displayed in maps and figures which can be downloaded.
This diagram gives an overview of the tools: