
Multidimensional scaling (MDS) is used for exploring dialect continua. In contrast to the reference point maps, which show the linguistic distances only from one chosen site to all other sites, MDS visualizes the linguistic relationships between all the sites in the data set simultaneously.
MDS is a statistical method which reduces complex distance data into interpretable dimensions. Generally, MDS is used to scale data into two or three dimensions, since more dimensions are very difficult to visualize. When applying MDS to dialect data, three dimensions are generally enough since many studies have shown that three dimensions explain at least around 90% of the total variance in dialect data.
If you go to Multidimensional scaling - mds plots in Gabmap, you see the result of MDS to two dimensions. All places have got a position in a two-dimensional coordinate system. Hovering the mouse cursor over the dots in the plot displays the site names. Linguistically similar sites are found close to each other in the plot, while linguistically different ones have a large distance in the plot. The plot can help to identify outliers in the data set or to recognize dialect groups (that is, clouds in the plot).
|
Which county in Pennsylvania has the most divergent dialect? |
The MDS map displays the result of MDS to three dimensions. In MDS to three dimensions, positions in a three-dimensional space are assigned to all varieties included in the analysis. The three-dimensional space can be thought of as this color cube:
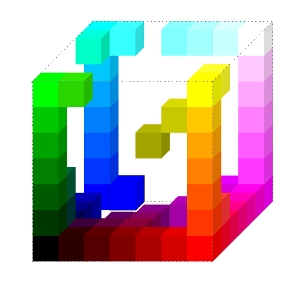
All dialects in the data set get a position in this cube and at the same time a specific color. Dialects that are linguistically similar to each other are placed close to each other in the MDS space and hence get similar colors, while dialects that are very different from each other are assigned positions and colors far away from each other in the cube (for example, in opposite corners of the cube).
The three-dimensional MDS map (Multidimensional scaling - mds maps) is created by coloring the area of each site on the map with the color assigned by MDS. Separate maps of each of the first dimensions of the MDS are displayed under the three-dimensional MDS map in Gabmap.
|
Look at the three-dimensional MDS map of Pennsylvania. Are there any abrupt dialect borders? Are there transitional borders? Can clear dialect groups be identified? |
|
Compare the MDS map to the reference point map (see previous topic) of the place Huntingdon. What do the two different methods of visualizing dialect differences tell about dialects? |