
|
Which dialect groups in Pennsylvania can be identified with high confidence? |
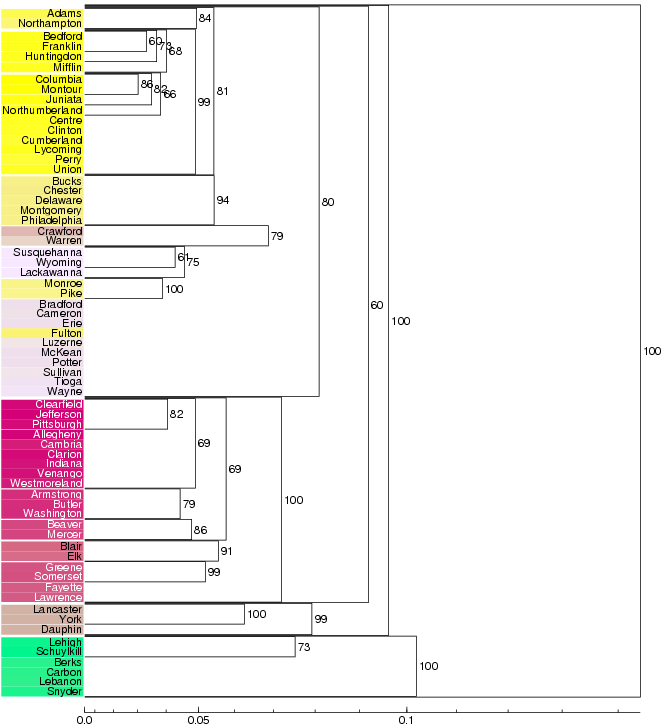
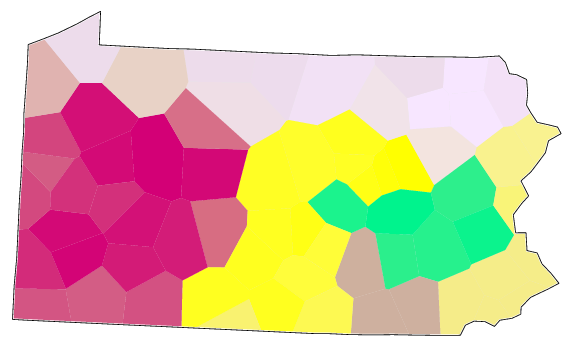
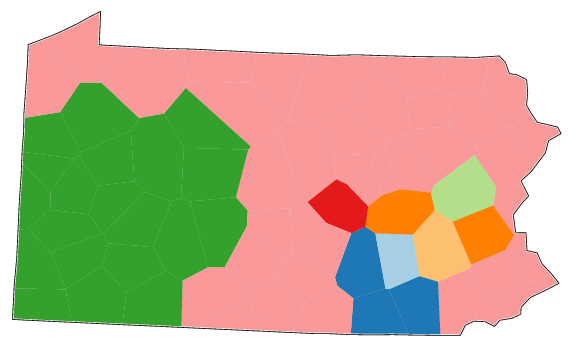
With fuzzy clustering, a division into two groups can be made of the Pennsylvanian dialects with 100% confidence. This two-way split separates south-eastern (green; German influenced, see Solutions - distribution maps) dialects from the rest of the Pennsylvanian dialects. The hierarchical structure within the green cluster cannot be detected with very high confidence.
The rest of the dialects can roughly be divided into three groups: one small cluster (brown; the counties Lancaster, York, and Dauphin), a western cluster (red), and a larger cluster with mainly northern and central dialects.
Within the northern and central cluster, the central (yellow) area is detected with 99% confidence. The counties in the south-eastern corner of Pennsylvania (Bucks, Chester, Delaware, Montgomery, Philadelphia) also form a dialect group with very high confidence (94%).
At lower hierarchical levels there are some small clusters that seem very stable. For a dialect division the large groups are generally more interesting than small subclusters.
|
Look at the map of eight clusters with Weighted Average as clustering method. Compare this map to the difference maps (Differences - statistics and difference maps). Is there an agreement between the line maps on the one hand and the cluster map on the other? What is similar? What is different? |
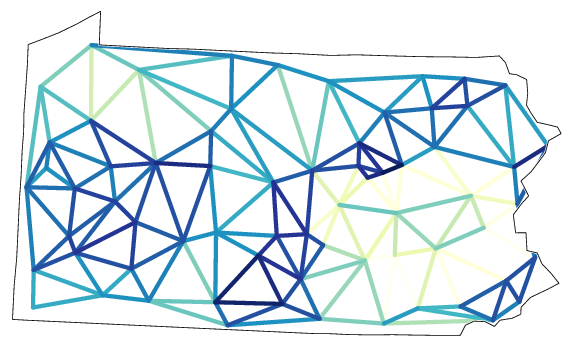
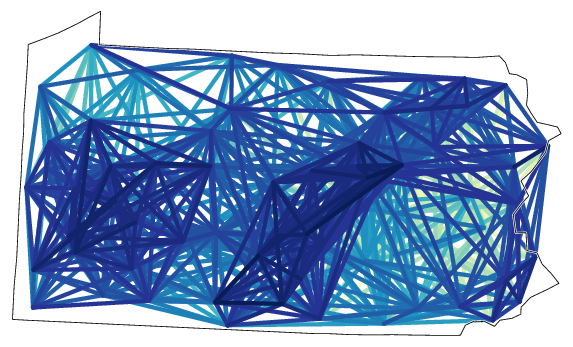
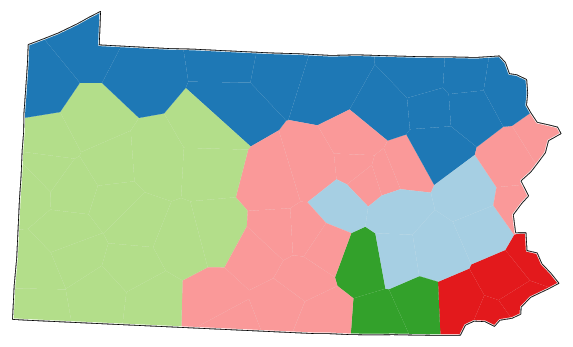
Clustering with the Weighted Average method counts the divergence of the dialects in the east very heavily. There are many small clusters in the east, some of them comprising only one place. In comparison with the line map these results are not that surprising, the line maps show that there are very large dialect differences in the east. The western area can be identified in both the line maps and in the cluster map. The big pink area in the cluster map seems to be a rest area in which no internal structure has been identified.
|
Compare the results of six clusters using Ward's Method to the results of fuzzy clustering. Are the results similar? |
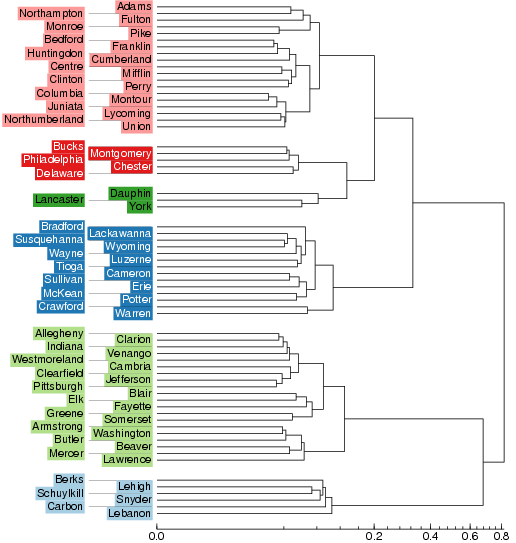
The cluster map with six clusters extracted with Ward's Method looks very similar to the fuzzy cluster map: The German-influenced area in Pennsylvania can be identified, there is a western, a northern, and a central cluster, the south-eastern corner of Pennsylvania is identified, and there is the small cluster with only the three counties Lancaster, York, and Dauphin.
However, the first major split into two branches in the dendrogram of Ward's Method puts the light blue German-influenced area and the light green western area into one group, and the northern and the remaining eastern area in the other. So if you would make a classification into two groups this is the grouping you would get. But the fuzzy clustering separates the German-influenced dialects from all the other ones with high confidence in the first step. The probabilistic dendrogram uses Group Average and Weighted Average as clustering methods. These methods do not have the bias of Ward's method to try to make equal size clusters.
|
Compare the map of six clusters using Ward's method to the one of eight clusters with Weighted Average as clustering method. Which one is better? |
There is no right or wrong answer to this question. When you use cluster analysis you should think about why you want to classify dialects and choose the method that suits your purposes best. Ward's method produces relatively equally-sized clusters, but does not acknowledge the fact that the distances within one cluster might be larger than across some of the other groups. Weighted Average gives a strong signal of the linguistic distances, but producing classes with only one member might not be meaningful in all circumstances. It is important to validate results of cluster analysis, for example, by using fuzzy clustering or by comparing to the results of MDS.